Tempe’s growth from a small agricultural stop on the Maricopa and Phoenix Railroad into a dense urban core of 185,000 residents has placed critical infrastructure directly atop the complex alluvial deposits of the Salt River channel. The transition from shallow Holocene silts to deeper Pleistocene conglomerates creates sharp impedance contrasts that standard code-based site classification often smooths over. For projects near the Tempe Town Lake basin or the ASU Research Park, where soft lakebed clays meet cemented gravels at depths of 15 to 40 feet, a seismic microzonation study becomes the only way to map how shaking energy will actually propagate upward through the column. We integrate multi-channel surface wave testing with deep SPT borings logged under ASTM D1586 to build 2D cross-sections that capture lateral stratigraphic pinch-outs, buried paleochannels, and the depth to the 2,500 ft/sec shear-wave velocity horizon that ASCE 7-22 requires for Site Class determination. Where the MASW profile shows a velocity reversal below 30 feet—common in the western Tempe corridor—we refine the amplification factors with 1D equivalent-linear ground response analysis to avoid the unconservative spectral accelerations that a generic Site Class D envelope would produce.
A generic Site Class D envelope can underestimate spectral acceleration at 1.0-second period by 40% in the deep basin beneath Tempe's Salt River corridor.
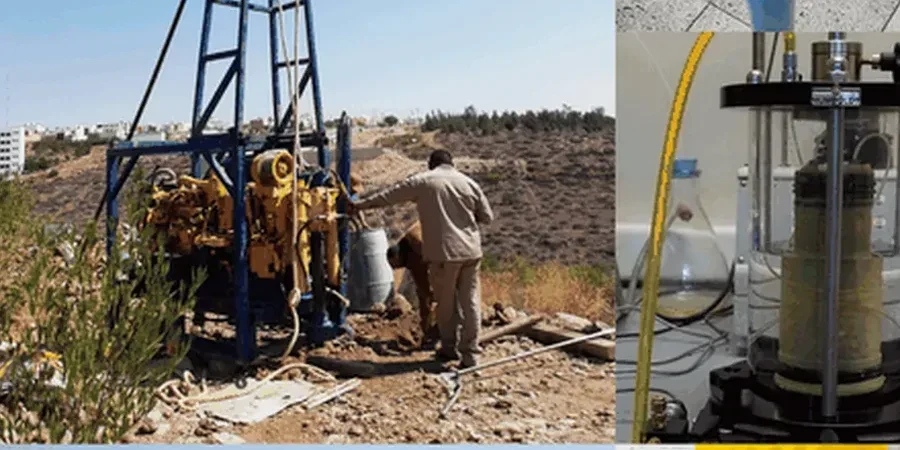
Scope of work in Tempe Arizona
Risks and considerations in Tempe Arizona
The most expensive mistake we see in Tempe is the engineer who runs two SPT borings to 30 meters, classifies the site as Class D from blow counts alone, and calls the seismic hazard analysis complete. In the Salt River basin, that approach misses the velocity inversion that occurs when loose-to-medium-dense Holocene channel sands—with Vs around 600 ft/sec—overlie cemented Pleistocene fanglomerates with Vs exceeding 1,500 ft/sec. The 30-meter time-averaged Vs might still land in the Class D bracket, but the impedance contrast at 20 to 35 feet concentrates shear strain in the upper soft layer, producing amplification factors 30 to 50 percent higher than the default table values. We have pulled cores from the Tempe Town Lake area where the contrast is so sharp that a 10-foot-thick soft clay lens generated a site period of 0.8 seconds in a zone the general code maps label as short-period dominated. Neglecting this means the structural engineer designs for the wrong part of the response spectrum, and the liquefaction analysis misses the excess pore pressure buildup that the trapped soft layer sustains under cyclic loading. Basin-edge effects along the Tempe Butte bedrock outcrop also generate surface waves that travel horizontally and add late-arriving energy to the ground motion record—something no Vs30-based classification can predict.
Our services
A seismic microzonation study in Tempe must deliver more than a single Vs30 value. Our scope is structured around the specific failure modes and amplification mechanisms present in the eastern Salt River Valley:
2D Basin Response Modeling
We construct cross-sections along the building footprint using borehole and surface wave data, then run 2D finite-element wave propagation to capture lateral scattering and basin-edge surface wave generation that 1D analyses omit.
Site-Specific Response Spectra
Using equivalent-linear or nonlinear time-domain analysis, we derive uniform hazard spectra at 5% damping for the 475-year and 2,475-year return periods, including soil amplification factors Fa and Fv tailored to the actual Vs profile at the Tempe site.
Liquefaction Susceptibility Mapping
For sites east of Priest Drive where the groundwater table rises above 20 feet, we map the liquefaction potential index across the parcel using SPT-based triggering correlations, estimating post-liquefaction settlement and lateral spread displacement under the MCE ground motion.
Ground Motion Time History Selection
We select and spectrally match three-component acceleration records from the PEER NGA-West2 database, conditioned on the dominant seismic sources—the San Andreas, San Jacinto, and Basin and Range faults—and scaled to the site-specific target spectrum for use in structural dynamic analysis.
Quick answers
Does the City of Tempe require a site-specific seismic hazard study, or can we use the IBC mapped values?
For structures assigned to Risk Category I or II on a Site Class C or better, the IBC Chapter 16 mapped spectral accelerations are generally accepted. However, once the site class falls into D, E, or F territory—which covers most of Tempe south of the Salt River—ASCE 7-22 §11.4.8 triggers the requirement for a site-specific ground motion hazard analysis when the mapped S1 exceeds 0.2g. Tempe’s mapped S1 is 0.22g at the 2,475-year return period, so any Risk Category III or IV structure on Site Class D or worse requires the microzonation study we perform. For mid-rise buildings over 75 feet, the city plan review typically requests site-specific spectra regardless of classification.
How long does a complete microzonation study take for a typical Tempe commercial site?
Fieldwork—including four to six deep SPT borings with downhole Vs measurements and surface wave arrays at three locations—takes 5 to 7 working days on a 2-acre parcel. Laboratory testing adds 2 to 3 weeks for index properties and dynamic soil property curves. The 1D and 2D ground response modeling, record selection, and spectral matching require another 2 to 3 weeks of analysis. From mobilization to the final stamped report with design spectra and acceleration time histories, budget 6 to 8 weeks. Sites requiring 2D basin modeling or peer review by a third-party geotechnical panel add 2 to 3 weeks to the schedule.
What is the typical cost range for a seismic microzonation study in Tempe?
For a commercial site of 1 to 3 acres with four to six borings, surface wave testing, and 1D ground response analysis, the study cost ranges from US$3,980 to US$8,200 depending on drilling depth and laboratory scope. When the project requires 2D basin response modeling, site-specific time history selection with spectral matching, or covers a larger parcel exceeding 5 acres, the cost extends from US$9,500 to US$15,840. These figures include the final stamped report with design spectra ready for structural engineer use. We provide a fixed-fee proposal after reviewing the geotechnical boring logs and the structural loading criteria.